Asheville Market Insight, June 2025
Greetings and salutations.
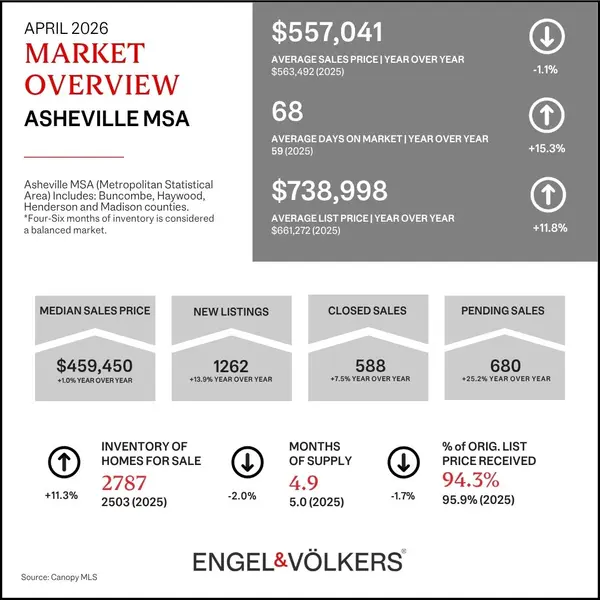
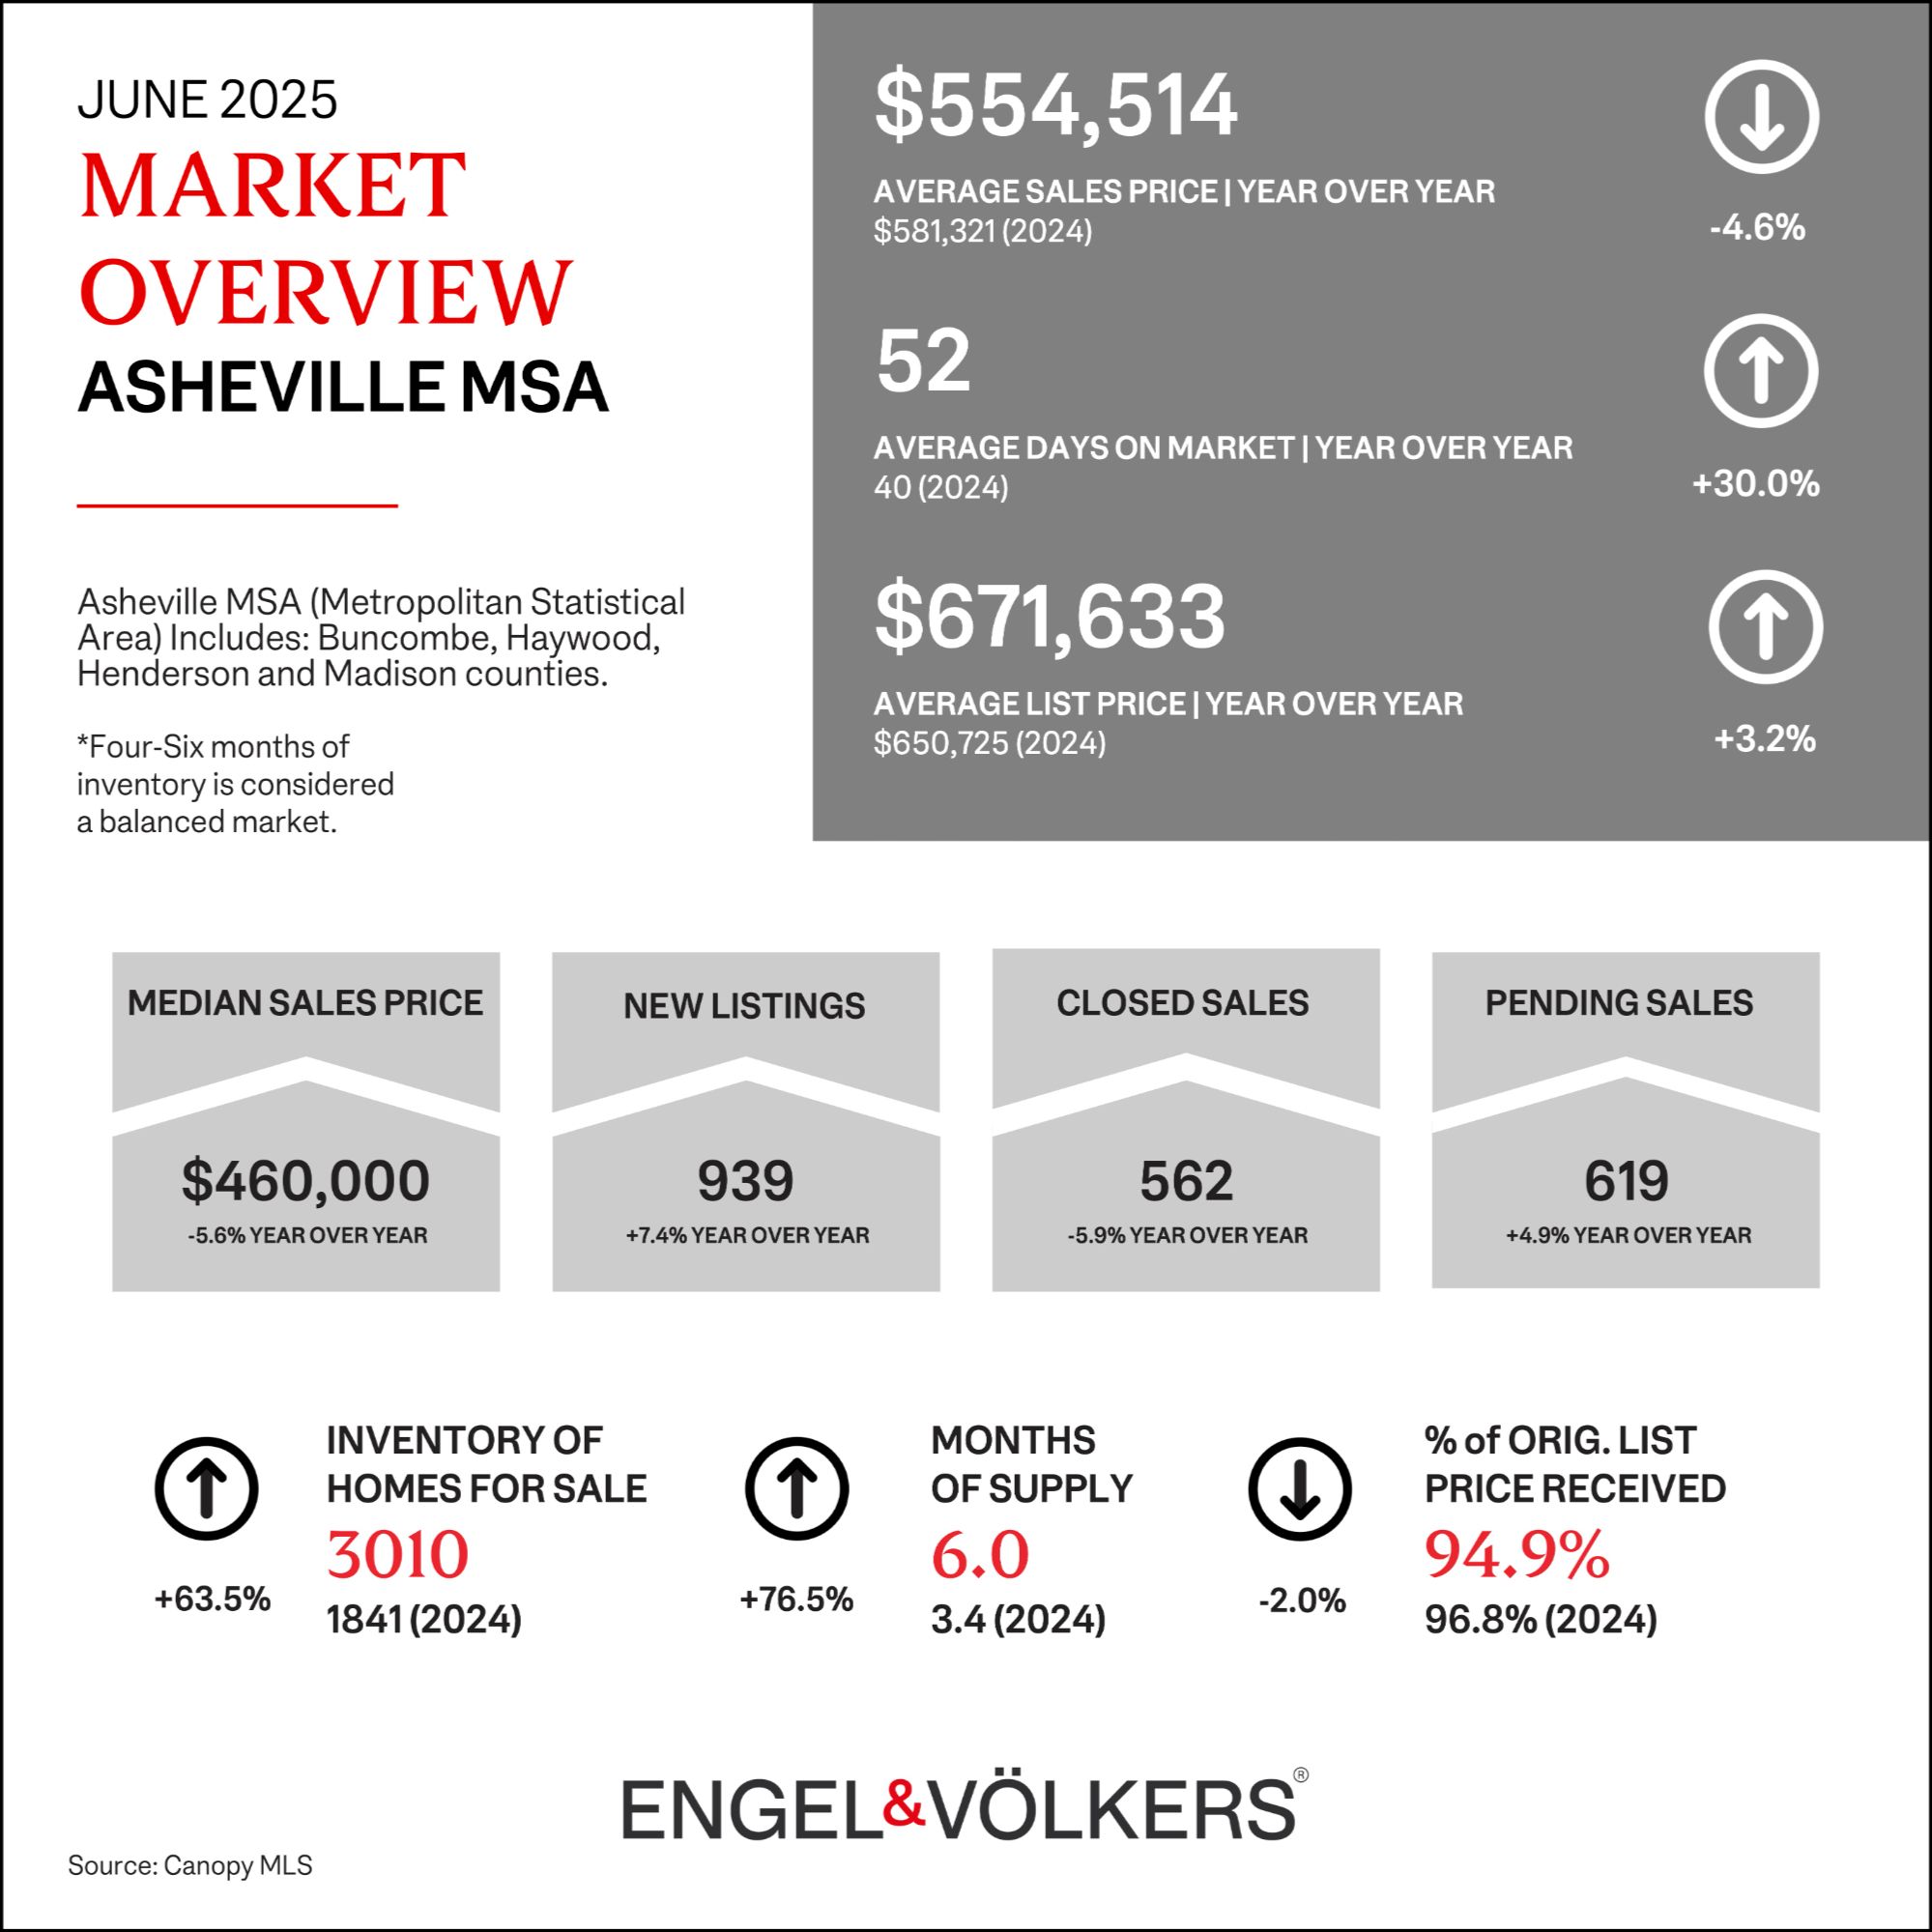
Let's look back to see when the major real estate stats for single family homes looked as they do now. For total inventory, we'll need to look back to October 2019 to find more homes available. For months supply, we have to go all the way to September 2016 to find a larger number. Side bar, what's the difference between inventory and months supply? Total inventory is, as it sounds, the total number of homes available for purchase. Months supply factors in something called "absorption rate" which is the rate at which homes are selling in a given time period, essentially demand. You can think of months supply as the length of time it would take for the available homes to completely sell out if no new homes were to hit the market. For years we had an absorption rate that was in line with the strong seller's market we experienced. Now, the absorption rate indicates a much more balanced market, a market of opportunity.
Knowing these indicators helps in real ways. It helps with setting expectations, it helps with pricing strategies, it helps with making and negotiating offers and it helps with how to proceed once under contract. Along with one's own goals and desires, data can guide us.
Reach out for data on your specific area and let me know how I can help you.
Categories
Recent Posts